Monday, February 28, 2011

Wheres the market heading?


E-Mini S&P 500 Index Futures, March 11

Voice your opinion in the comments.

Krames

Friday, February 25, 2011

AstraZeneca and Gorgeous OmniVision Technologies trade


AZN - AstraZeneca looks to be due for a movement up north, I have a target price if all goes well of around 58

In other news... my trade of the day:

2/23 bought OVTI March 11, 27 strike calls ------- average fill of 0.35

2/25 sold OVTI March 11, 27 strike calls ---------- average fill of 3.20

814% ? Not bad!

Thursday, February 24, 2011

Freeport-McMoRan Copper and Gold

Strategic Hotels and Resorts


If BEE is around my 6.09 Price level within the next week and a half as it approaches the support intersect, I'm a buyer.

Sprint is one to watch closely...

A good opportunity to go long... but not yet.  Wait for this to trade lower/sideways to about 4.10 and then a long will probably be in order.  This could be a good play for early next week.

Long AIG


Another earnings play, and its close to a intersecting support point, I feel a strong upside bet.

Dreamworks


Earnings after the close - I dont think this is goign to break lower quite yet, but rather rise up back towards the upper resistance. Long

Wednesday, February 23, 2011

Nice Earnings Play


OVTI - down big the past two days, partly due to the market confusion yesterday with all the worldly conflict, and again today due to a downgrade of RW Baird's target from $35 to $24.  Earnings tomorrow with these technicals make this a pretty buy for me.

I just put my order in for calls.

Monday, February 21, 2011

ACI 8.10 Steps


Interesting chart, since the '08 bottom it seems to have been trading within various trading ranges, each having an interval of 8.10 higher than the previous.  If history should repeat itself, ACI should remain under the 35.85 level for another 5 months or so, trading in the 8.10 range.  However, a triangle also seems to be forming where it currently sits, and a rebound in the 32.30/50 level could send this stock right through the 35.85 level.

Tuesday, February 15, 2011

Sprint Resistance

S

Saturday, January 29, 2011

S chart update

V - A good technical long reinforced with upcoming earnings Wednesday

Not much else to say other than what reads in the title of this post.

Friday, January 28, 2011

IM Chart Revisit

Heres an update of how an old chart I posted HERE on IM unfolded; it could be at a key level.


When I posted this previously, the blue support had just met its first touch after IM had broken through the white support and turned it into a level of resistance.  Shortly after, prices pushed back towards the white resistance, and came back down to the blue support level of 14.66, yeilding a nice opportunity to play the trading range and make profits in both directions.   IM has since made a nice rally and risen back up to the white resistance. 

With markets widely down today, it will be interesting to see how the stock reacts at these levels.

Krames

Thursday, January 27, 2011

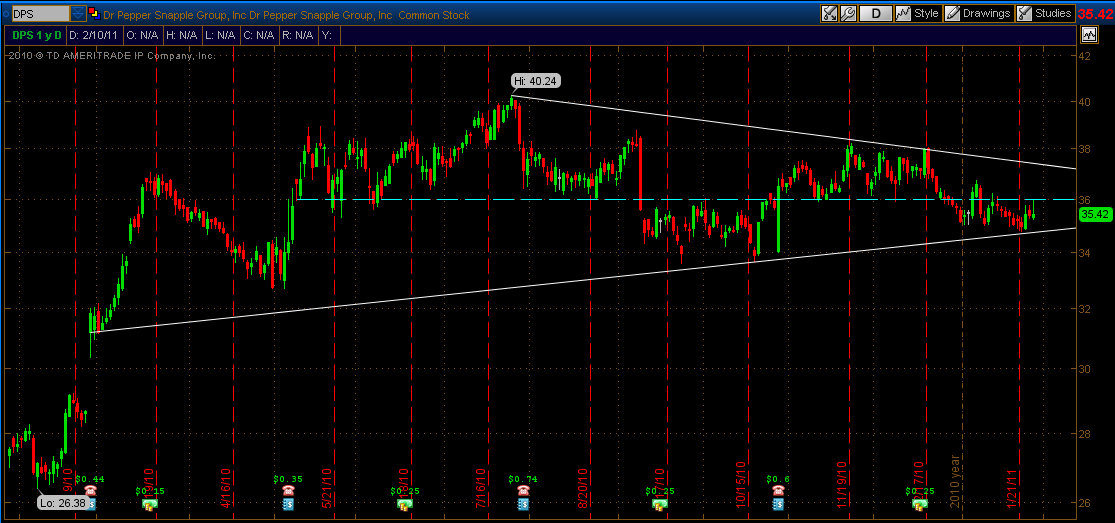
One to watch, Dr. Pepper


This should be interesting to follow in the next few weeks. The stock has been trading within narrowing range, and is now approaching the axis.  What is also interesting about this chart is how prices have been using the middle dotted line both as support and resistance, pushing through to favor the other side every so often.

I feel this may be a good opportunity for some profit towards the upside.

Krames

Pop out?


Glimcher Realty Trust should be popping up on a nice looking chart, solidified by some positive real estate news.

Shoulda seen this one coming...


Maybe next time

Saturday, January 22, 2011

C


Target of 6.50

Monday, August 30, 2010

Golden Star

GSS Golden Star Resources

Friday, August 27, 2010

Sprint Nextel going up?

Remember THIS chart from about a month ago?  Well it looks as if Sprint Nextel may be in for a streak upwards soon.

Thursday, August 26, 2010

Wheat; who knows what people are thinking anymore

Price is high, and so is open interest.  Looks like a double touch on this line; personally I think the algorithmic models with asset allocation based on market momentum overloaded on this Ag and drove the price way higher than it should have gone. 

"Wheat prices increased for the first time in a week after the U.S. Department of Agriculture said global production will drop 5.1 percent to a three-year low. " (Bloomberg) OK so let me think about this... Production is down 5.1%... why from June 10th to August 6th did the price of futures more than double?  Over speculation if you ask me. 

Who the frig cares if  worldwide production is to "fall to 645.7 million metric tons in the year that began June 1 from 680.3 million a year earlier."(Bloomberg)  Only an idiot would think that every single ounce of that wheat will be going right to plants for production, theres always a hoarded stockpile somewhere.  Sure prices should go up some, but even now I believe we are too high.  I thought this was a short before, and i still do,; it should have never gotten this high.